

Why flipbook statistics matter
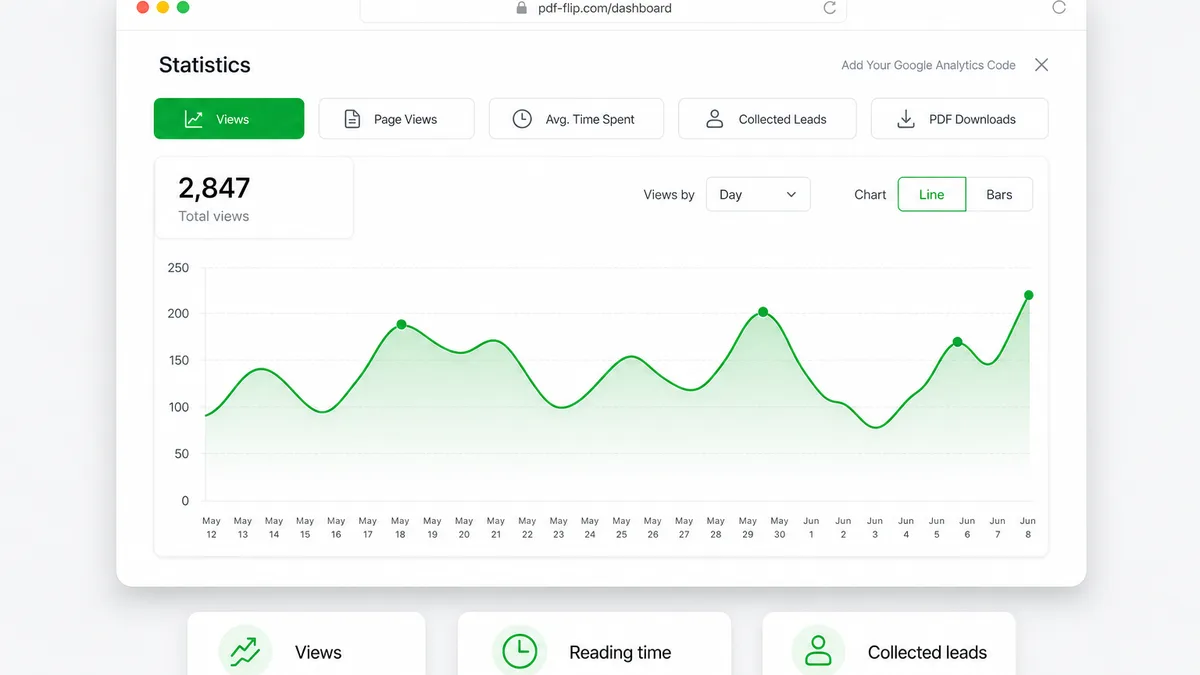
Shipping a link is not the same as knowing it worked. Statistics show whether people opened the book, which pages they stayed on, and whether they downloaded or submitted a lead.
Use the data to improve catalogs, sales decks, and campaign books instead of guessing from vanity traffic alone.
What you can measure
- Views over time
- Page engagement so you see which spreads hold attention
- Average reading time
- PDF downloads
- Collected leads for the same reporting window
Everything lives in your Professional dashboard next to the flipbook, not in a separate analytics product.
How teams use it
- Publish the flipbook and share the link or embed.
- Open Statistics for that publication.
- Check views and page performance.
- Compare downloads and leads for the same period.
- Update weak pages, then measure again.
Common setups
Catalog optimization
Find pages readers skip, then fix product order or hotspots.
Campaign reporting
Show stakeholders views, time spent, and leads from one book.
Sales enablement
See whether decks get opened after you send them.
Details that matter in practice
- Page-level insight beats a single view count.
- Leads and downloads sit next to engagement.
- Pair with Lead Capture Forms for full funnel visibility.
- See Pricing for Professional availability.
FAQ
What metrics are tracked?
Views, page engagement, average reading time, collected leads, and PDF downloads.
Can I see which pages perform best?
Yes. Page engagement shows which pages hold attention.
Are leads tied to the same period?
Yes. Leads can be reviewed alongside performance for the same timeframe.
Who gets statistics?
Statistics are available on the Professional plan.


